After some delay we now proudly present our first wind tunnel measurements. Where we were measuring two wing segments in comparison in our small wind tunnel. Finally the numbers are evaluated with already impressive results, where everybody can see the obvious arguments quantified, speaking for the aeroflexible feature.
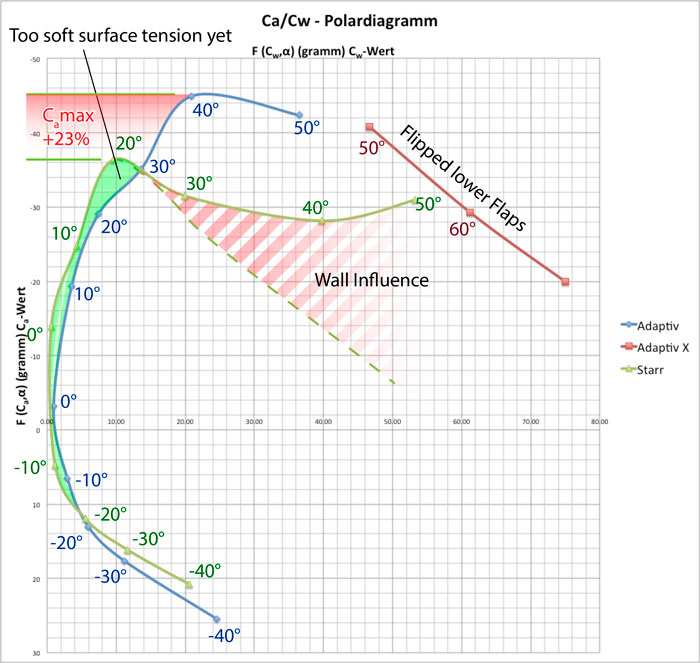
For now we compared a wing section of a small model plane (dimensions see table) with a wing section of the same size - but with adaptive Features. The green line shows the behavior of the classic wing, while the blue and red lines describe the adaptive Wing.
As the diagram shows in some features the advantage of the profile is outstanding. Especially on higher attack angles the profile shows significant higher lift forces. The measurements show a quantified increase of Lift by 23,67% along with much less air drag compared to a classical Wing segment.
Though superior on higher attack angles the behavior of the surface is yet not optimal configured, so at lower attack angles it currently performs less (green Area). But this quantified behavior is accounted to the current configuration and does not falsify the principle at all like someone might think. We already work on the next evolution generation which is designed to solve this deficit and to advance into the green area.

Image 1: Lilienthal-polars. 1.) green graph: classic wing 2,3) blue & red graph: adaptive wing
Note: values are not normalized yet
The additional red line at >=50° indicates an organic mode of the aeroflexible wing where when the stagnation point moves down the lower side, an automatic wing span increase is triggered to improve lift in critical situations.
For the measurements, the tunnel we used was a self made rectangular box at the size of 30x30x100cm, also regularly used for demonstration purposes at our exhibition booths. Yet, due to the relatively small size of the cross section in the wind tunnel the wing acts as a blockade. Thus in this configuration we get additional wall influences who then distort the values. Therefore the real curve at higher attack angles should be lower for both profiles (dashed line indicated at the green diagram).
Although someone might get confused by the values which are yet not adapted on standardized measurements methods and also show distractions at higher levels. At that point we would like to focus on the statement this examination should deliver. The evidence which was made is a RELATIVE behavior of a known rigid profile. A replacement by standardized measurement methods will not falsify this evidence.
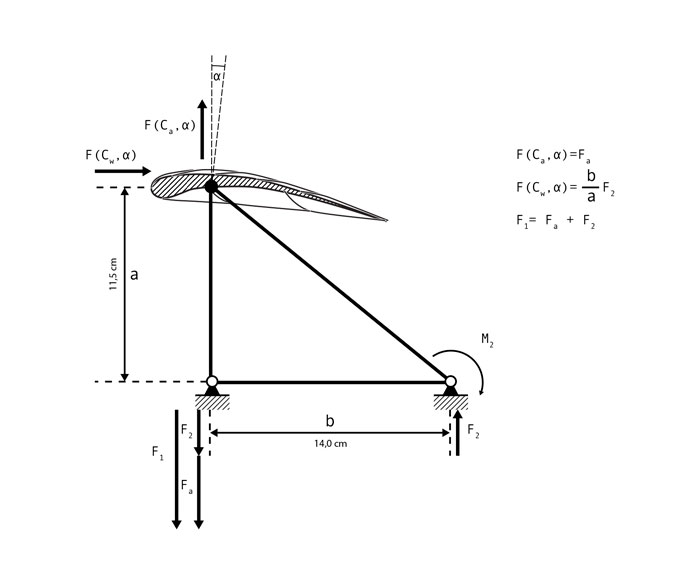
Image 2: Mechanics of the construction and force recalculation (due to clarity not all dimensions are included)
|
Raw Data of the Wind Tunnel: |
|
|
Size: |
30x30x100cm |
|
Probe: |
|
|
Wing Section Type: |
Reely Sky Hawk Wing |
|
Measurement Tools: |
|
|
GoPro Camera: |
@240fps (Windspeed measurements) |
Images and Diagrams:
{gallery}blog/Measurements_01b/{/gallery}
NOTE: The Units in the Diagrams are not yet normalized so they indicate the real forces measured in grams.


